
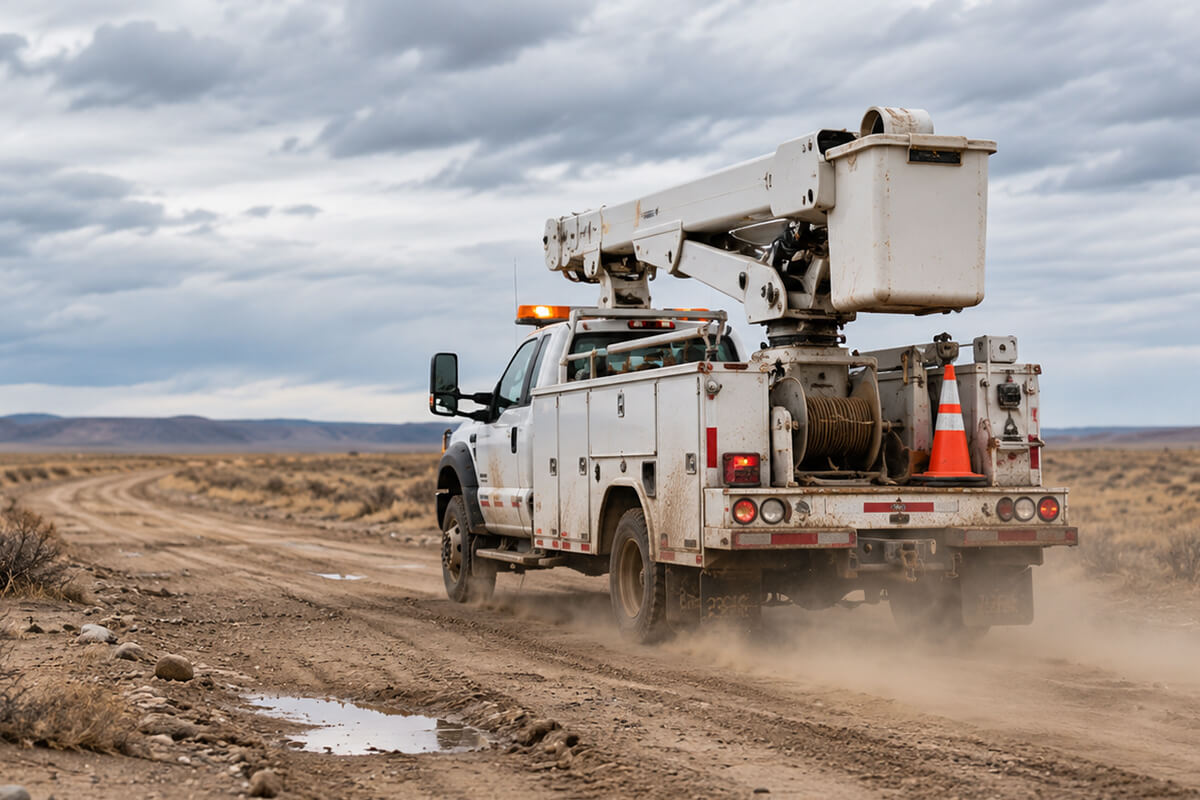
Ask a line crew where the network gives out, and you won’t need a coverage map.
They’ll name the road. The valley. The stretch of desert or forest where calls drop, maps stop loading and nothing uploads until the truck is back in town.
Every utility has these spots, and most crews have learned to work around them.
Fleet connectivity: key takeaways
- Weak coverage is only one part of the problem. Antenna placement, cable loss and in-vehicle equipment can also affect connectivity.
- Yard tests can hide failures that appear in rural, fringe or stressed network conditions.
- Start with the locations and applications that fail most often before deciding whether the fix is a new carrier, new hardware or a different installation.
How workarounds hide fleet connectivity problems
Crews build habits around weak coverage:
- Download maps and work orders before heading into a known weak area
- Wait for an app to reconnect, then try again
- Switch devices to get one more bar
- Save reports and upload them later
These habits keep the work moving. But because crews absorb the cost quietly, it rarely shows up anywhere the business can see it. And with field work now running on GIS, digital work orders and dispatch updates, a lost connection slows the work down with it.
Why yard tests miss real-world vehicle connectivity problems
Check a new install in the yard and you’ll see full bars and fast uploads. That test says very little about where crews actually work. Strong signal hides weak equipment.
The weaknesses show up where the signal is thin, which is exactly where utility work is hardest:
- Rural territory: long distances between towers, with hills, canyons and tree cover in the way
- Fringe coverage: the edge of the map, where one bar is a good day
- Stressed networks: during storms, wildfires, heat events and grid outages, when cell sites may be damaged, without power or running on backup
How antenna cable loss weakens cell signal strength
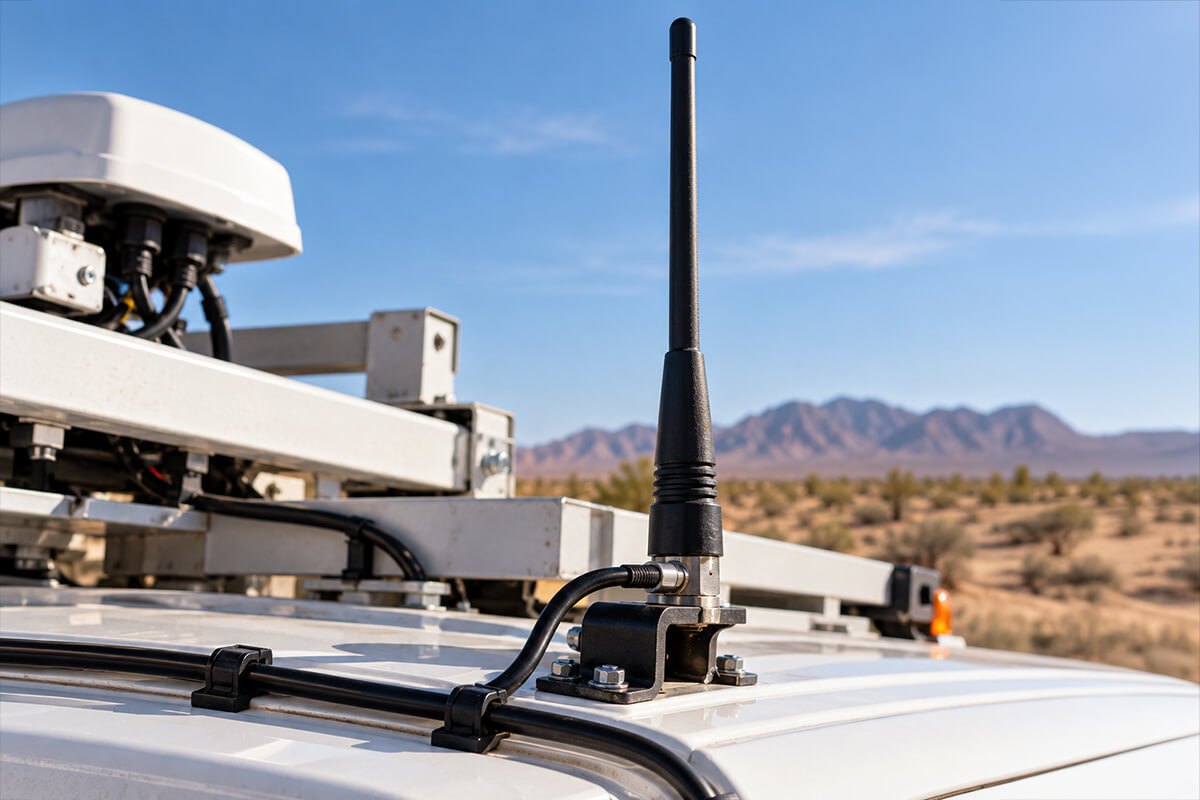
In a typical setup, the antenna sits on the roof and the modem sits in the cab. The cable between them loses signal over every metre. A common low-loss cable loses about 0.37 dB per metre at 900 MHz, and more at higher 4G and 5G frequencies (Times Microwave LMR-195 datasheet). A typical 4–6 metre run can cost around 2 dB.
In plain terms: roughly a third of the signal is gone before it leaves the truck. In town, nobody notices. On one bar, that’s the upload that fails. So some of your crews’ trouble spots may not be pure coverage problems. They may be places where the truck can’t use the signal that’s there.
How to diagnose fleet connectivity problems
When complaints pile up, the usual question is: which carrier has the best coverage? A more useful one is: where does our workflow break down?
- Which locations do crews report problems in again and again?
- Which applications fail there: maps, uploads, VPN?
- What do crews do instead, and how long does it take?
- Which of those places matter most during an emergency?
The answers usually come down to a short list of places and applications. That’s a far easier problem to solve than “better coverage everywhere.”
Know your toughest spot?
If your crews can point to it on a map, we can help. Contact us →
Next in this series: Your Primary Carrier Is Only One Part of Your Connectivity Strategy.